2. Using Protocol Logging
Protocol logging allows you to
track Simple Mail Transfer Protocol (SMTP) communications that occur
between servers as part of message routing and delivery. These
communications could include both Exchange servers and non-Exchange
servers. When non-Exchange servers send messages to an Exchange server,
Exchange does the protocol logging of the communications.
You use protocol
logging to troubleshoot problems with the Send and Receive connectors
that are configured on Hub Transport and Edge Transport servers.
However, you shouldn't use protocol logging to monitor Exchange
activity. This is primarily because protocol logging can be processor
intensive and resource intensive, which means that an Exchange server
may have to perform a lot of work to log protocol activity. The overhead
required for protocol logging depends on the level of messaging
activity on the Exchange server.
2.1. Configuring Protocol Logging
By default, Hub Transport
and Edge Transport servers do not perform protocol logging. As long as
you know the identity of the connector with which you want to work, you
can configure protocol logging for a specified connector. To retrieve a
list of available Send and Receive connectors for a server, use the
Get-SendConnector and Get-ReceiveConnector cmdlets, respectively. If you
run either cmdlet without specifying additional parameters, a list of
all available Send or Receive connectors is returned.
You enable or disable protocol
logging on a per-connector basis. For Send connectors, you use the
Set-SendConnector cmdlet to enable protocol logging. For Receive
connectors, you use the Set-ReceiveConnector cmdlet to enable protocol
logging. Both cmdlets have a –ProtocolLoggingLevel parameter that you
can set to Verbose to enable protocol logging or to None to disable
protocol logging. Here is an example:
Set-ReceiveConnector -Identity "Corpsvr127\Custom Receive Connector"
 -ProtocolLoggingLevel 'Verbose'
Although you enable
protocol logging on a per-connector basis, you configure the other
protocol logging parameters on a per-server basis for either all Send
connectors or all Receive connectors using the Set-TransportServer
cmdlet. As it does with message tracking logs, Exchange Server
overwrites the oldest protocol logs automatically when tracking logs
reach a maximum age or when the maximum log directory size is reached.
If you decide to move the protocol log directories, you should create
the directories you want to use and then set the following required
permissions:
Full Control For Administrator
Full Control For Local System
Read, Write, And Delete Subfolders And Files For Network Service
Because the parameters are similar to those for message tracking, I'll summarize the available parameters. Table 2 shows the Send connector parameters for configuring protocol logging. Table 3 shows the Receive connector parameters for configuring protocol logging.
Tip:
You can configure send and
receive protocol log paths in the Exchange Management Console. Expand
the Server Configuration node, and then select the Hub Transport node.
In the main pane, double-click the server you want to configure to
display the related Properties dialog box. On the Log Settings tab, the
Protocol log panel shows the current send and receive protocol log
paths. You can specify the log file path by entering the desired
directory path for logging or accept the default setting.
Table 2. Send Connector Parameters for Protocol Logging
| PARAMETER | DESCRIPTION | DEFAULT |
|---|
| SendProtocolLogPath | Sets the local file path for protocol logging of Send connectors | %ExchangeInstallPath%\TransportRoles\Logs\ProtocolLog\SmtpSend |
| SendProtocolLogMaxFileSize | Sets the maximum size for Send connector protocol logs | 10 MB |
| SendProtocolLogMaxDirectorySize | Sets the maximum size for the Send connector protocol log directory | 250 MB |
| SendProtocolLogMaxAge | Sets the maximum age for Send connector protocol logs | 30.00:00:00 |
Table 3. Receive Connector Parameters for Protocol Logging
| PARAMETER | DESCRIPTION | DEFAULT |
|---|
| ReceiveProtocolLogPath | Sets the local file path for protocol logging of Receive connectors | %ExchangeInstallPath%\TransportRoles\Logs\ProtocolLog\SmtpReceive |
| ReceiveProtocolLogMaxFileSize | Sets the maximum size for Receive connector protocol logs | 10 MB |
| ReceiveProtocolLogMaxDirectorySize | Sets the maximum size for the Receive connector protocol log directory | 250 MB |
| ReceiveProtocolLogMaxAge | Sets the maximum age for Receive connector protocol logs | 30.00:00:00 |
2.2. Working with Protocol Logging Properties and Fields
When protocol logging is
enabled, a Mailbox server or a transport server creates protocol logs
daily. Mailbox and transport servers store logs in either the
%ExchangeInstallPath%\TransportRoles\Logs\ProtocolLog\SmtpSend or
%ExchangeInstallPath%\TransportRoles\Logs\ProtocolLog\SmtpReceive
directory as appropriate for the type of connector being logged. For
POP, IMAP, and Hotmail content aggregation, related logs are in the
%ExchangeInstallPath%\TransportRoles\Logs\ProtocolLog\HTTPClient
directory. Each log file is named by the date on which it was created,
using the format SENDYYYYMMDD-N.log or RECVYYYYMMDD-N.log, such as
SEND20100925-1.log for the first Send connector log created on September
25, 2010. Additional protocol logs are found in subdirectories of the
%ExchangeInstallPath%\Logging directory. In the AddressBook Service
subdirectory, you'll find logs for the Address Book service. In the RPC
Client Access subdirectory, you'll find logs for Remote Procedure Calls
for Client Access services.
The protocol log stores each
SMTP protocol event on a single line. The information on a particular
line is organized by comma-separated fields. Logs begin with a header
that shows the following information:
A statement that identifies the file as either a Send connector protocol log or a Receive connector protocol log
The date on which the log file was created
The version of the Exchange Server that created the file
A comma-delimited list of fields contained in the body of the log file
Table 4 summarizes SMTP event fields and
their meanings. Not all of the fields are tracked for all protocol
events. You can view the protocol log files with any standard text
editor, such as Notepad. You can also import the protocol log files into
a spreadsheet or a database.
Table 4. Protocol Log Fields
| LOG FIELD | DESCRIPTION |
|---|
| Date-time | The date and time of the protocol event in a locale-specific format. For U.S. English, the format is YYYY-MM-DDTHH:MM:SSZ, such as 2010-03-21T23:30:59Z. |
| Connector-id | The distinguished name of the connector associated with the event. |
| Session-id | The globally unique identifier of the SMTP session. Each event for a particular session has the same identifier. |
| Sequence-number | The number of the event within an SMTP session. The first event has a sequence number of 0. |
| Local-endpoint | The
local endpoint of the SMTP session, identified by the Internet Protocol
(IP) address and Transmission Control Protocol (TCP) port. |
| Remote-endpoint | The remote endpoint of the SMTP session, identified by the IP address and TCP port. |
| Event | The type of protocol event: + for Connect, – for Disconnect, > for Send, < for Receive, and * for Information. |
| Data | The data associated with the SMTP event. |
| Context | The context for the SMTP event. |
2.3. Enabling Protocol Logging for HTTP
Client Access servers
have Web-based applications and virtual directories that use Microsoft
Internet Information Services (IIS) to provide the related services. In
IIS 7.0 or IIS 7.5, protocol logging for HTTP is a feature is available
when HTTP Logging module is installed and logging is enabled. By
default, this module is installed with IIS and enabled. The default
configuration is to use one log file per Web site per day.
You can view and manage the logging settings by completing the following steps:
Start
Internet Information Services (IIS) Manager. Click Start, point to
Programs or All Programs as appropriate, point to Administrative Tools,
and select Internet Information Services (IIS) Manager.
Note:
By default, IIS Manager
connects to the services running on the local computer. If you want to
connect to a different server, select the Start Page node in the left
pane and then click the Connect To A Server link. This starts the
Connect To Server Wizard. Follow the prompts to connect to the remote
server. Keep in mind that with IIS 7.0 and IIS 7.5, the Windows Remote
Management Service must be configured and running on the remote server.
When
you install Exchange Server, the default Web site is created (or
updated) to include the virtual directories and Web-based applications
used to provide Web-based services for
Exchange Server. In IIS Manager, double-click the entry for the server
with which you want to work, and then double-click Sites.
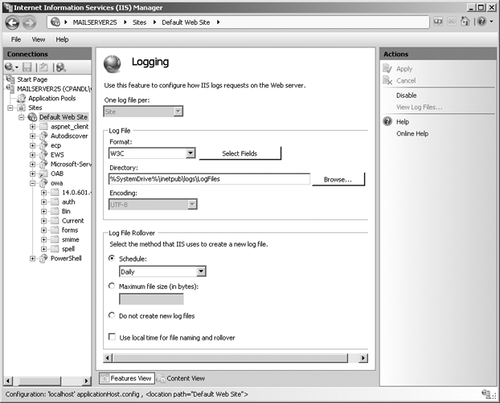
In
the left pane, select the Web site that you want to manage, and then
double-click Logging in the main pane to open the Logging feature as
shown in Figure 1.
If
all logging options are dimmed and the server is configured for
per-site logging, you can click Enable in the Actions pane to enable
logging for this site. Otherwise, if logging is configured per server,
you need to configure logging at the server level rather than at the
site level; the procedure is similar.
Use the Format selection list to choose one of the following log formats:
W3C Extended Log File Format
Writes the log in ASCII text following the World Wide Web Consortium
(W3C) extended log file format. Fields are space-delimited, and each
entry is written on a new line. This style is the default. Using this
option allows you to include extensive information about clients, servers, and connections.
Microsoft IIS Log File Format
Writes the log in ASCII text following the IIS log file format. Fields
are tab-delimited, and each entry is written on a new line. Using this
option allows you to collect basic information about clients, servers,
and connections.
NCSA Common Log File Format
Writes the log in ASCII text following the National Center for
Supercomputing Applications (NCSA) common log file format. Fields are
space-delimited, and each entry is written on a new line. When you use
this option, log entries are small because only basic information is
recorded.
Tip:
W3C Extended Log File Format is
the preferred logging format because you can record detailed
information. Unless you're certain that another format meets your needs,
you should use this format.
On
the Log File panel, use the Directory text box to set the main folder
for log files. By default, log files are written to a subdirectory of
%SystemDrive%\inetpub\logs\LogFiles.
On
the Log File Rollover panel, select Schedule and then use the related
selection list to choose a logging time period. In most cases, you'll
want to create daily or weekly logs, so select either Daily or Weekly.
If you selected W3C, click Select Fields, and then choose the fields that should be recorded in the logs. Click Apply.
2.4. Working with HTTP Protocol Logs
On Client Access servers,
HTTP protocol log files can help you detect and trace problems with
HTTP, Outlook Web App, Exchange ActiveSync, and Outlook Anywhere. By
default, Exchange Server writes protocol log files to a subdirectory of
%SystemDrive%\inetpub\logs\LogFiles. You can use the logs to determine
the following:
Whether a client was able to connect to a specified server and, if not, what problem occurred
Whether a client was able to send or receive protocol commands and, if not, what error occurred
Whether a client was able to send or receive data
How long it took to establish a connection
How long it took to send or receive protocol commands
How long it took to send or receive data
Whether server errors are occurring and, if so, what types of errors are occurring
Whether server errors are related to Windows or to the protocol itself
Whether a user is connecting to the server using the proper logon information
Most protocol log files are
written as ASCII text. This means you can view them in Notepad or
another text editor. You can import these protocol log files into Office
Excel 2007 in much the same way as you import tracking logs.
Log files, written as space-delimited or tab-delimited text, begin with a header that shows the following information:
A statement that identifies the protocol or service used to create the file
The protocol, service, or software version
A date and timestamp
A space-delimited or tab-delimited list of fields contained in the body of the log file
3. Using Connectivity Logging
Connectivity logging allows you
to track the connection activity of outgoing message delivery queues.
You use connectivity logging on transport servers to troubleshoot
problems with messages reaching their designated destination Mailbox
server or recipient.
3.1. Configuring Connectivity Logging
By default, Hub
Transport and Edge Transport servers do not perform connectivity
logging. You can enable or disable connectivity logging on a per-server
basis by setting the –ConnectivityLogEnabled parameter of the
Set-TransportServer cmdlet to $true or $false, as appropriate. The
following example enables connectivity logging on MailServer16:
Set-TransportServer -Identity "MailServer16"
 -ConnectivityLogEnabled $false
Tip:
You can configure
basic connectivity logging options in the Exchange Management Console.
Expand the Server Configuration node and then select the Hub Transport
node. In the main pane, double-click the server you want to configure to
display the related Properties dialog box. On the Log Settings tab,
select or clear the Enable Connectivity Logging check box. If you enable
connectivity logging, you can specify the log file path and then click
OK.
Each transport server in your organization can have different connectivity logging settings:
Use the
–ConnectivityLogPath parameter to move the log directory to a new
location. The default location is
%ExchangeInstallPath%\TransportRoles\Logs\Connectivity directory.
Use the –ConnectivityLogMaxFileSize parameter to set the maximum log file size. The default maximum log file size is 10 MB.
Use
the –ConnectivityLogMaxDirectorySize parameter to set the maximum log
directory size. The default maximum log directory size is 250 MB.
Use the –ConnectivityLogMaxAge parameter to set the maximum log file age. The default maximum age is 30.00:00:00.
As it does with other logs,
Exchange Server overwrites the oldest connectivity logs automatically
when tracking logs reach a maximum age or when the maximum log directory
size is reached. If you decide to move the protocol log directories,
you should create the directories you want to use and set the following
required permissions:
Full Control For Administrator
Full Control For Local System
Read, Write, And Delete Subfolders And Files For Network Service
3.2. Working with Connectivity Log Properties and Fields
Exchange Server creates
connectivity logs daily and stores them in the
%ExchangeInstallPath%\TransportRoles\Logs\Connectivity directory. Each
log file is named by the date on which it was created, using the format
CONNECTLOGYYYYMMDD-N.log, such as CONNECTLOG20100325-1.log for the first
connectivity log created on March 25, 2010.
The connectivity log
stores outgoing queue connection events on a single line. The
information on a particular line is organized by comma-separated fields.
Logs begin with a header that shows the following information:
A statement that identifies the file as a connectivity log
The date on which the log file was created
The version of Exchange Server that created the file
A comma-delimited list of fields contained in the body of the log file
Table 5 summarizes connectivity
logging fields and their meanings. Not all of the fields are tracked
for all outgoing queue connection events. You can view the connectivity
log files with any standard text editor, such as Notepad. You can also
import the connectivity log files into a spreadsheet or a database, as
discussed previously.
Table 5. Connectivity Log Fields
| LOG FIELD | DESCRIPTION |
|---|
| Date-time | The date and time of the outgoing queue connection event. |
| Session | The
globally unique identifier of the SMTP session. Each event for a
particular session has the same identifier. For Messaging Application
Programming Interface (MAPI) sessions, this field is blank. |
| Destination | The name of the destination Mailbox server, smart host, or domain. |
| Direction | The direction of the event: + for Connect, – for Disconnect, > for Send, and < for Receive. |
| Description | The
data associated with the event, including the number and size of
messages transmitted, Domain Name Server (DNS) name resolution
information, connection success messages, and connection failure
messages. |